
A gold-prospecting map that shows where to pan, and why.
Terrain physics, historic mines, active claims, land ownership and live water, on one map.
Pannable reads the landscape from USGS 1 m LiDAR and scores where moving water tends to drop heavy placer gold, then layers in the public records a prospector needs: 55,000 USGS gold occurrences, BLM mining claims on a weekly refresh schedule, who manages the land, and how the rivers are running this week. Plan a trip from the couch or check a creek from the bank.
Free during the beta. United States only. A research aid, not a promise of gold.
Four things no other prospecting map puts together
Where gold tends to settle
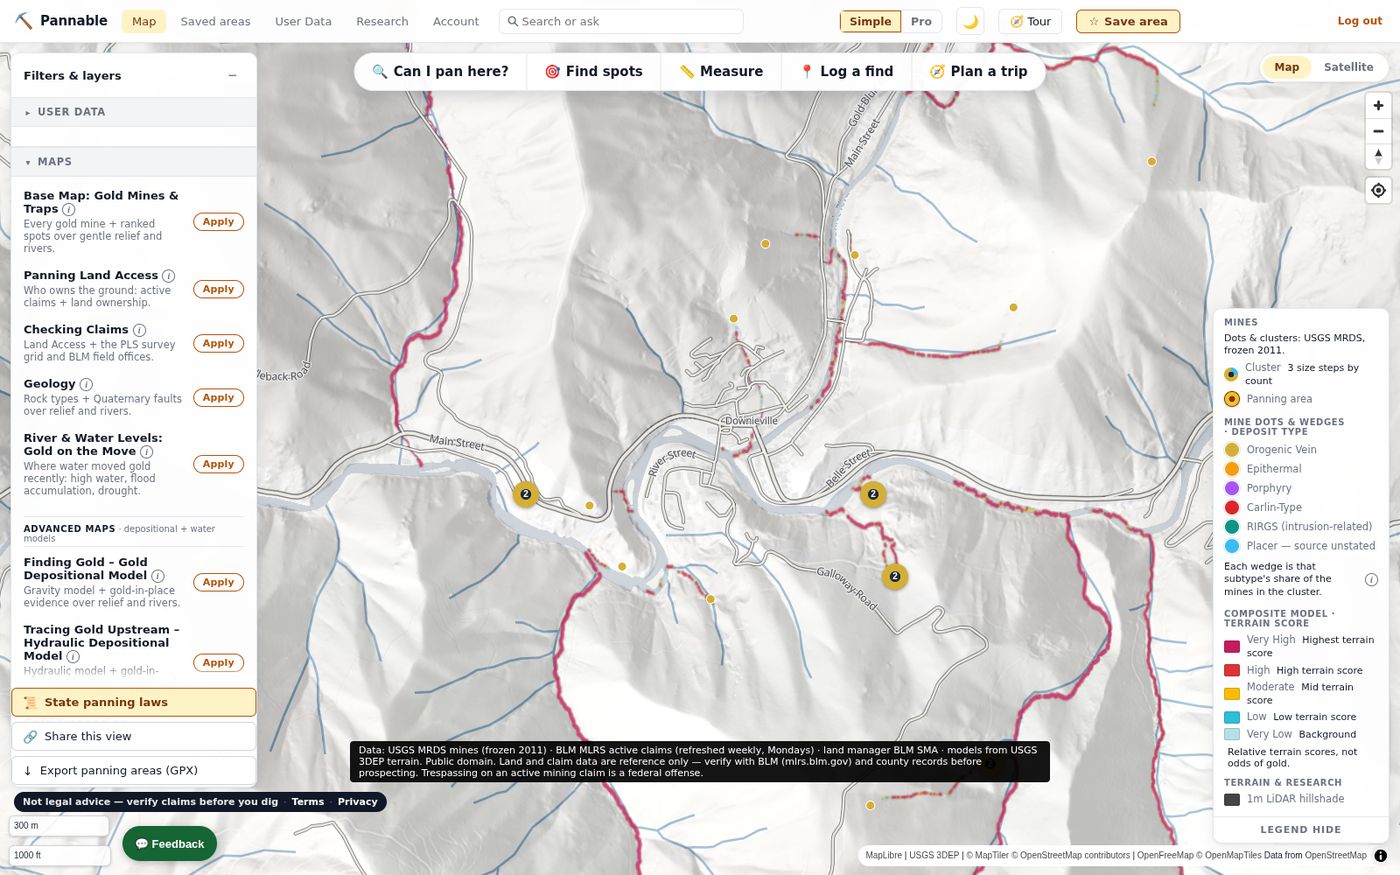
Depositional models read 1 m LiDAR terrain and score where water loses the energy to carry heavy gold: inside bends, gradient breaks, bedrock traps, confluences. Relative scores, painted on the map.
Where gold was actually found
Every USGS-recorded gold occurrence in the United States, with a 0–10 Pan Potential score from its deposit type and production history, plus national and on-screen rankings.
What public records say about panning there
Active BLM mining claims (scheduled weekly, with the data date shown), land manager, protected areas and state rules, summarized in one “Can I pan here?” reading with its reasons, its data date and its caveats. It reports records, not permission.
What the water has been doing
Live USGS gages light up rivers that are running high (high water is dangerous; pan after flows drop), a season-phase layer reads the snowpack, and the River Reset Clock tells you when a reach last had a gold-moving flow.
Terrain first, records second, your judgement last
- Start from the real ground. Pannable bakes its own hillshade and models from raw USGS 3DEP 1 m LiDAR wherever it exists, and falls back to 10 m national elevation where it does not. The legend says when the view falls back to 10 m.
- Simulate the water. Flow is routed over the real drainage network. The models score where transport energy collapses (hydraulic), where gold shed from known lode sources can travel (gravity), where both agree (composite), where exposed bedrock can hold it (crevice), and where a steep side gully drops what it carries (gulch).
- Layer the public record. USGS MRDS mine occurrences, BLM MLRS active claims, PAD-US and BLM land ownership, geology and faults, roads and trails, rivers, and live stream gages, each refreshed on a stated cadence.
- You decide. Scores are relative terrain rankings and the land-status reading is an estimate from public records. Pannable tells you where to look first and why; it does not promise gold and it is not a permit.
What you can do with it today
Screenshots are from the current web beta. The full tour, including rankings, trip tools and the research library, is on the features page.
Curated map presets
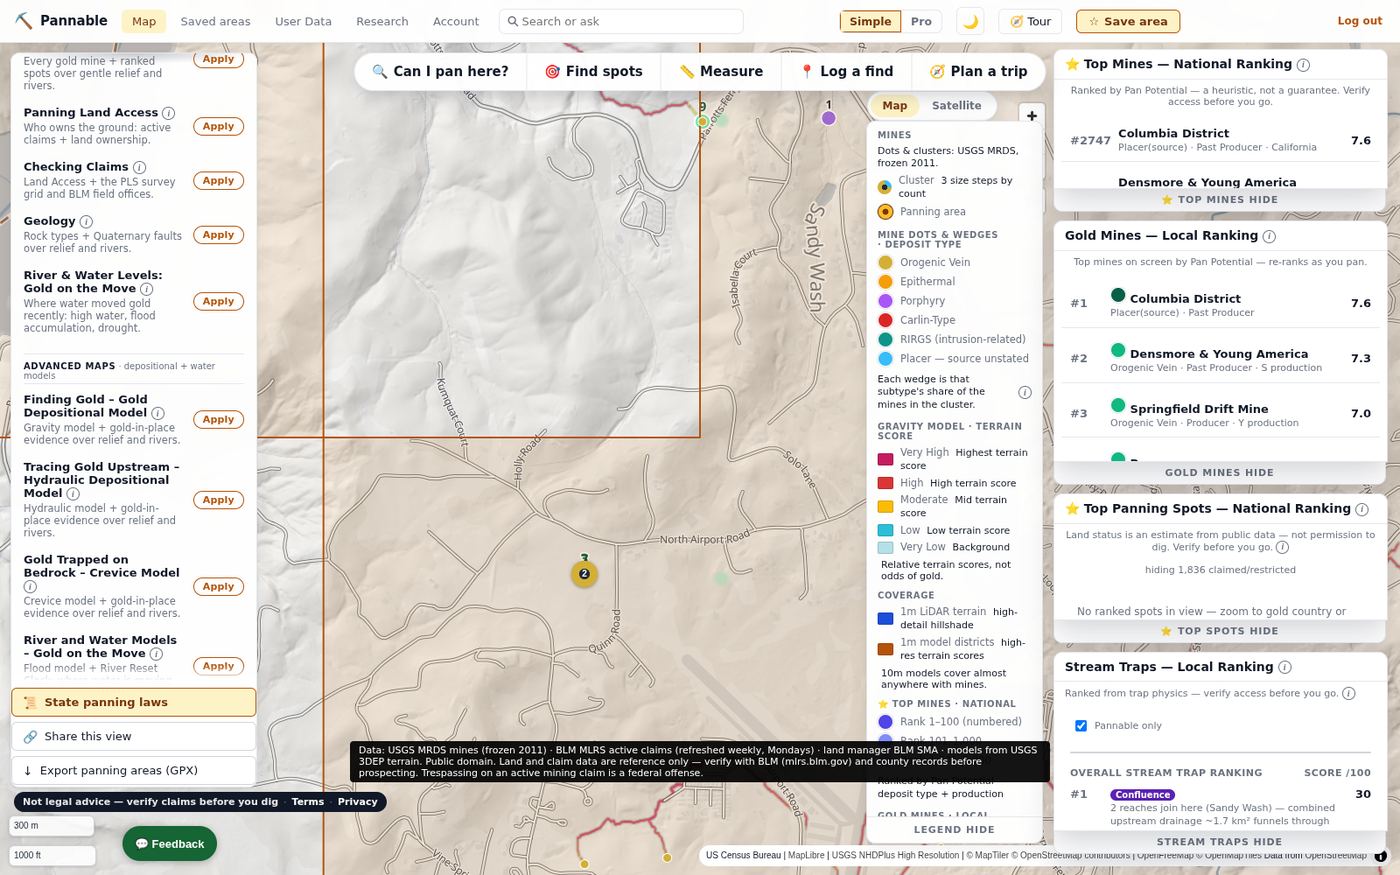
One click lays out a complete map: Finding Gold applies the Gravity model with gold-in-place evidence over LiDAR relief and rivers; Panning Land Access adds active claims and land ownership; Checking Claims adds the PLSS survey grid and BLM field offices; Geology and River & Water Levels round out the set.
Every preset opens the ranking windows too: Top Mines nationally, Gold Mines in view, Promising panning spots and Stream Traps.
Claims and land ownership
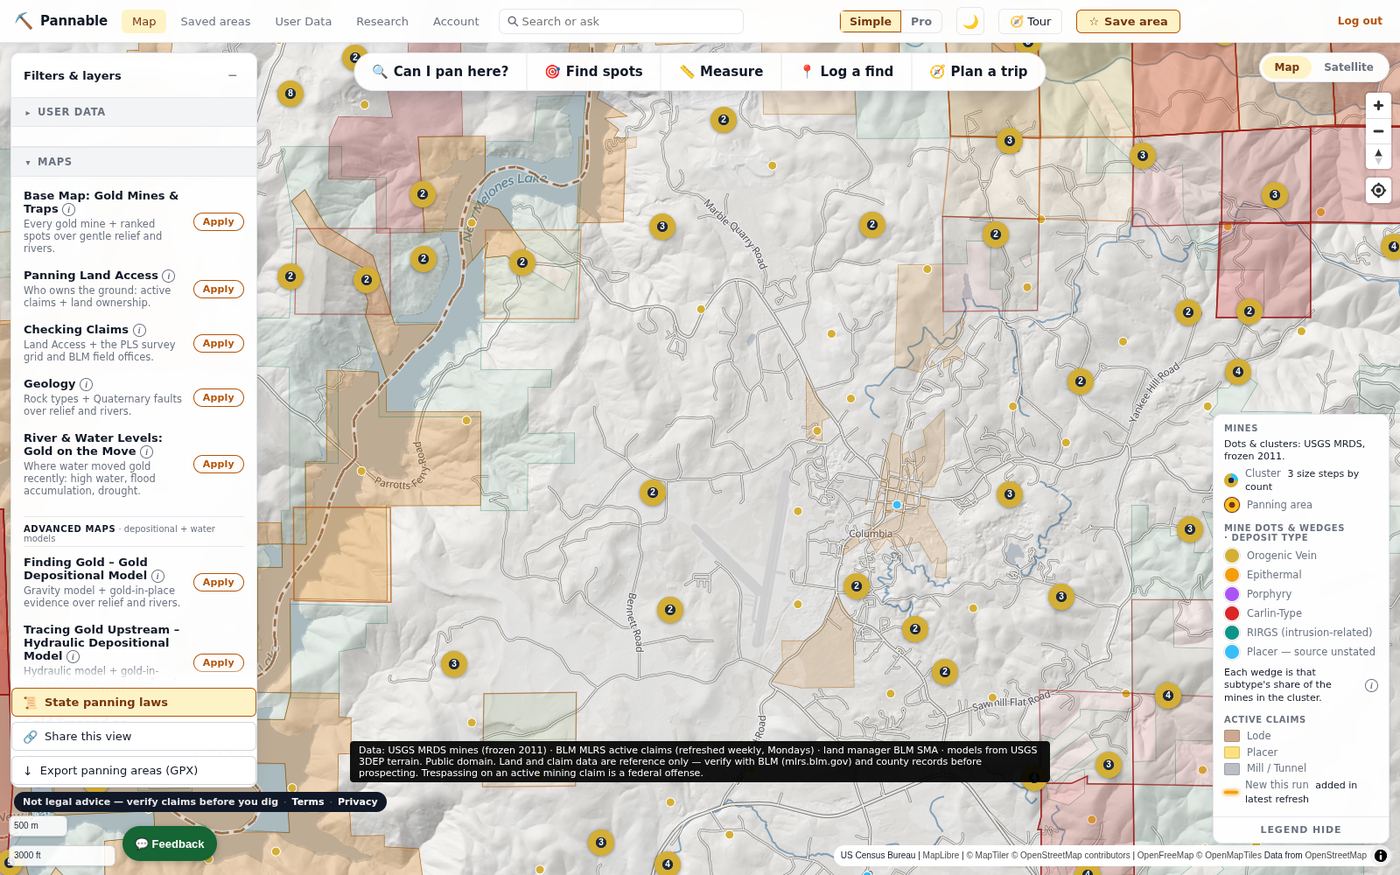
Active BLM mining claims are drawn as lode, placer and mill-site polygons, refreshed from BLM MLRS on a weekly schedule, with claims that appeared since the last refresh highlighted. Land ownership comes from PAD-US and the BLM surface-management dataset, so you can see at a glance whether a creek is Forest Service, BLM, state or private.
Claim boundaries are approximate (section and quarter-section resolution), and BLM publishes no staking date. The map says so, every time.
Every mine, scored
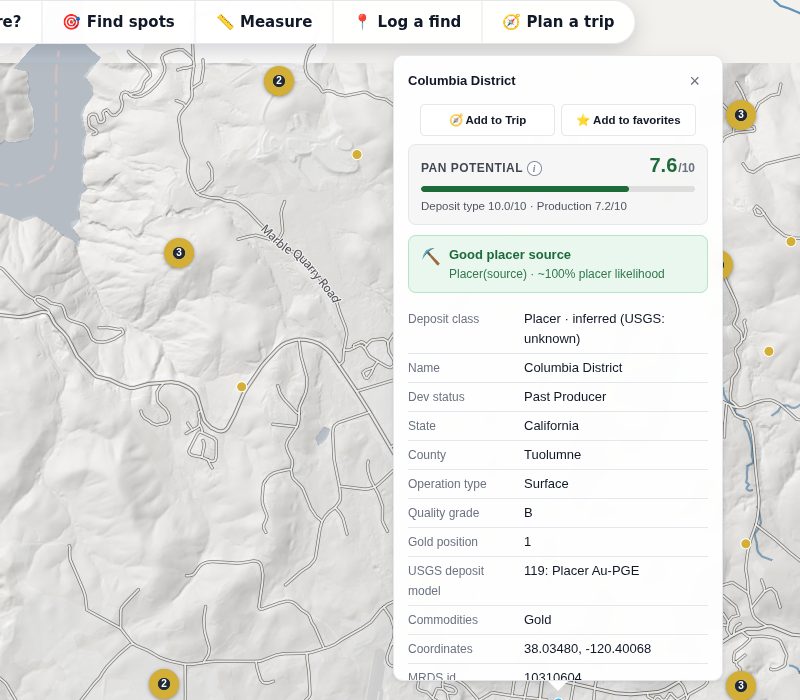
Click any of the ~55,000 USGS gold occurrences for its deposit type, production class, operation type and coordinates, plus a Pan Potential score (0–10) that estimates how much placer gold that kind of source tends to shed. Add it to a trip or to your favorites from the same card.
Pan Potential is a ranking aid built from the public record, not a guarantee.
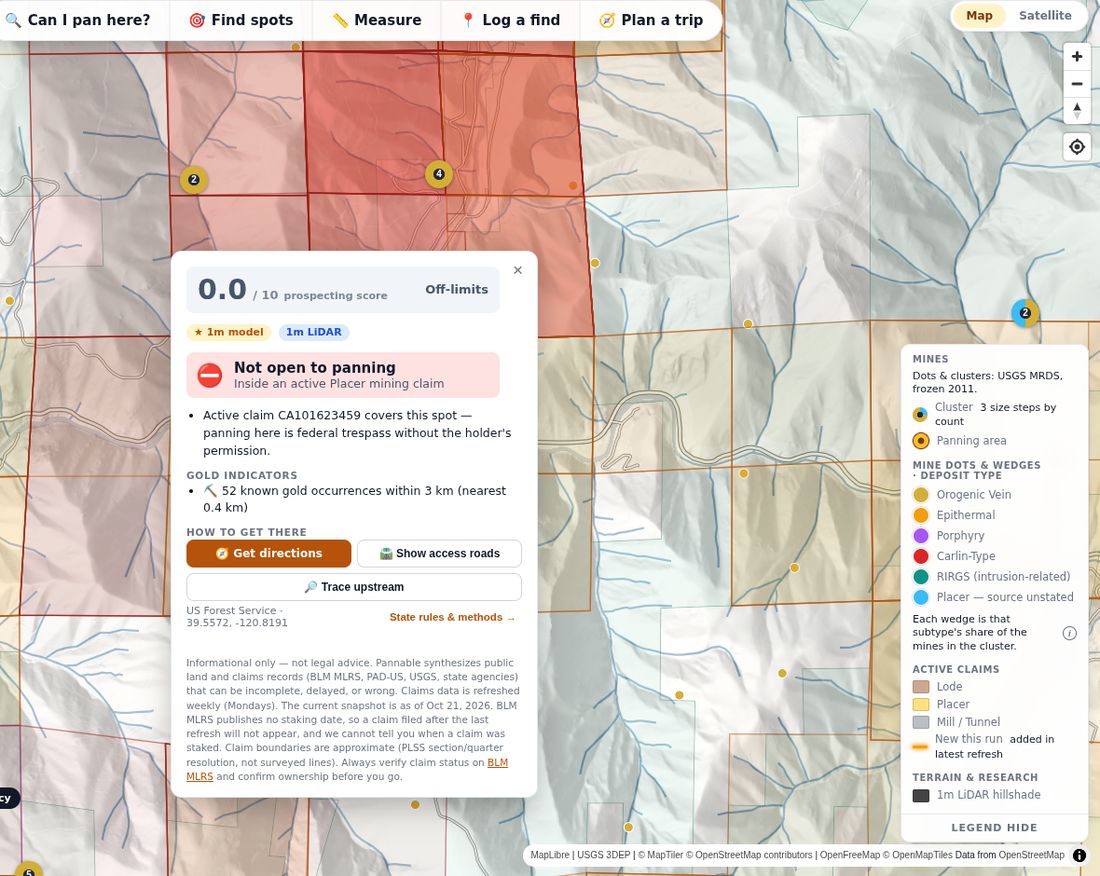
“Can I pan here?”
Tap a spot and get one answer with its reasons: active claims covering the point, the land manager, protected-area status and the state’s recreational-panning rules, plus the nearby gold evidence, directions and access roads. The verdict carries its own disclaimer and the date of the claims snapshot it was built from.
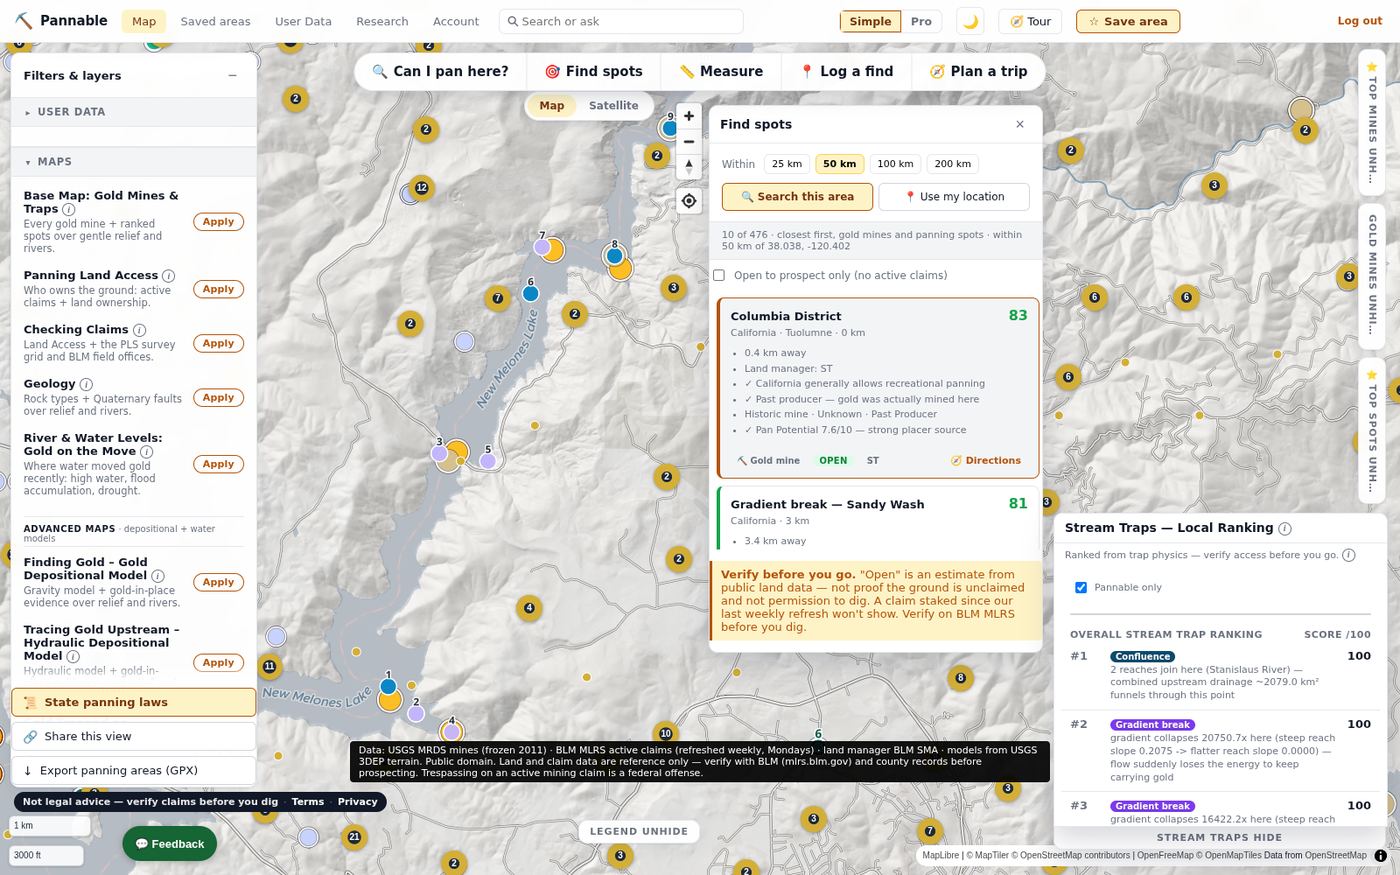
Find spots and stream traps
Find spots ranks the gold mines and panning spots within 25–200 km of a point, closest first, with the land status of each. The Stream Traps ranking reads the river network itself: confluences, gradient breaks and inside bends scored from the terrain, with a plain-English reason for each.
Physics on real terrain, explained honestly
Each model asks one question of the landscape. All of them produce relative terrain scores (Very Low to Very High) that rank ground within the area you are looking at. None of them measures gold.
Gravity
Where has gold shed from known lode sources travelled? Routes downhill transport from every recorded hard-rock mine along the real drainage network, decaying with distance.
Hydraulic
Where does the water drop its load? Computes stream power along the flow path and scores where it falls sharply: the energy collapses that let heavy particles settle.
Composite
Where do supply and settling agree? The geometric mean of Gravity and Hydraulic, so hot zones need both gold arriving and gold being forced to stop. The default model.
Crevice
Which bedrock can hold gold? At 1 m it looks for exposed-bedrock micro-relief in and beside active channels: ribs, potholes and crevices that act as natural riffles.
Gulch
Which gully is delivering coarse gold, and where does it stop? Covers the small feeder drainages the trunk-stream models skip. On the map at 1 m, only near recorded lode sources. Its constants are not fitted to any district, and it was not part of our July 2026 backtests.
Flood and River Reset
The time dimension. Rivers glow where live USGS gages show high water, and the River Reset Clock classifies each reach by when it last had an armor-breaking, gold-moving flow.
What we measured, plainly. The models are built to be physically correct, not fitted to find reports. When we did test them against held-out USGS placer occurrences in July 2026, they beat chance by a real but modest margin, and simply starting near known placer workings beat every model by roughly three to one. We treat model output as an additive signal on top of the historical record, and the Top Spots ranking weights historical evidence above trap physics for exactly that reason.
Not a guarantee of gold. Model output is a set of relative terrain scores: decision support for where to look first, not a measurement of gold and not a prediction that you will find any.
Informational only — not legal advice, and not a substitute for the advice of an attorney. Pannable synthesizes public land and claims records (BLM MLRS, PAD-US, USGS, state agencies) that can be incomplete, delayed, or wrong.
Verify before you dig: confirm current claim status on BLM MLRS and land-use rules with the managing office (BLM/USFS/state) at the actual site, every time. Prospecting on an active mining claim without the claimant's permission can expose you to civil liability and other penalties.
Public data, with its cadence and limits stated
| Layer | Source | Refresh | Coverage and caveats |
|---|---|---|---|
| Terrain and hillshade | USGS 3DEP 1 m LiDAR (raw cloud-optimized GeoTIFFs); USGS 10 m national elevation as the fallback | Baked in waves | 1 m models cover most western mining districts and the southeastern gold belt, not Alaska; the legend says when part of your view comes from 10 m terrain. |
| Gold occurrences | USGS Mineral Resources Data System (MRDS) | Frozen upstream (2011) | ~55,000 US gold records, enriched with a deposit classification and Pan Potential. |
| Active mining claims | BLM Mineral & Land Records System (MLRS) | Scheduled weekly; runs can fail or be delayed (date shown in the app) | Boundaries approximate; BLM publishes no staking date, so a claim filed since the last refresh is invisible. |
| Land ownership | USGS PAD-US 4.1; BLM Surface Management Agency | Periodic | Surface management only. Mineral rights can be split from the surface. |
| Geology and faults | USGS State Geologic Map Compilation; USGS Quaternary faults | Periodic | Geology covers the lower 48 states. Faults are simplified for reference, not survey-grade. |
| Rivers and water | USGS NHDPlus High Resolution flowlines; USGS stream gages; NOAA National Water Model; NRCS SNOTEL; US Drought Monitor | Weekly (gages, river reset, season phase) | Flood rivers only light up near gages. A stale feed fails the refresh rather than publishing. |
| Access and reference | BLM PLSS grid, recreation sites and field offices; USFS motor-vehicle roads and wilderness; USFWS critical habitat; Census TIGER boundaries; NWS forecasts | Live or periodic | Live federal map services can be slow; the app says when a layer is external. |
All federal data is public domain. Third-party basemap tiles and labels are credited in the map attribution. User data (finds, saved areas, field logs) is never sold and never shared for advertising. Other users see an item only if you choose to share it; see the Privacy Policy.
Research on the big screen, a field companion in your pocket
Web app: private beta
The full research platform runs in any modern browser: 30-plus layers, every model, rankings, trip planning, saved areas, your own gold log and claim boundaries, and a research library of state panning laws. Access is by invitation while we finish the beta; request beta access to ask for an account.
iOS and Android app: in development
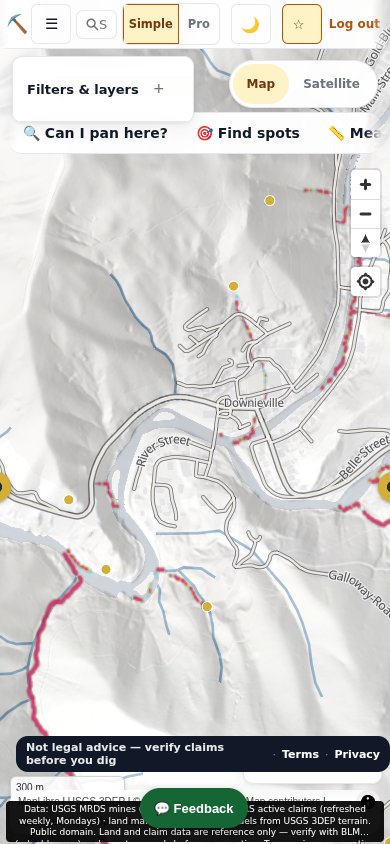
A deliberately lean field companion: the map with models and mines, a “Can I pan here?” verdict at your feet, GPS field mode, a find log with photos that stay on your device, and downloadable offline packs so the answer is there when the signal is not. It is not yet available in the App Store or Google Play; this page will say when it is.
Free during the beta
Beta (now)
Everything on this page, free, for invited beta users on the web. Your feedback shapes what ships.
Paid plans (coming)
Paid plans will fund the terrain bakes and the weekly data refreshes. We will publish prices before anything is charged, and nobody is charged during the beta. The public map data itself stays public.
Straight answers
Is this a guarantee of gold?
No. The models rank terrain by how well the physics of transport and deposition fits; a high score means “look here first,” not “gold is here.” Our own testing found that known workings are a stronger signal than any model, which is why the app always shows the historical record alongside the physics.
Informational only — not legal advice, and not a substitute for the advice of an attorney. Pannable synthesizes public land and claims records (BLM MLRS, PAD-US, USGS, state agencies) that can be incomplete, delayed, or wrong.
Verify before you dig: confirm current claim status on BLM MLRS and land-use rules with the managing office (BLM/USFS/state) at the actual site, every time. Prospecting on an active mining claim without the claimant's permission can expose you to civil liability and other penalties.
If the map says “open,” can I dig there?
"Open" is an estimate from public land data — not proof the ground is unclaimed and not permission to dig. A claim staked since our last claims refresh won't show. Verify on BLM MLRS before you dig.
Surface and mineral rights can be split, and state or local rules (dredging bans, seasonal closures, wild and scenic reaches, critical habitat) can apply even where the federal land is open.
How current are the claims?
Active claims are scheduled to refresh from BLM MLRS weekly, but a refresh can fail or be delayed, so the app shows the data date on every claim-related surface and stops showing “No restriction found” when that data is more than 10 days old. BLM does not publish a staking date, so Pannable cannot tell you when a claim was filed, only when it first appeared in our refresh.
Where does the 1 m terrain come from, and where is it available?
From the raw USGS 3DEP LiDAR cloud-optimized GeoTIFFs, not a smoothed image service. The 1 m models are baked district by district across the western United States and the southeastern gold belt where LiDAR exists (not Alaska); everywhere else the app drops to 10 m national elevation and labels it. A coverage outline on the map shows where the 1 m models are available.
How do I get access?
The web app is in private beta. Email support@pannable.app and tell us roughly where you prospect; we add people in batches. The mobile app is in development and not yet in the app stores.
Do you sell my location or my finds?
No. We do not sell your spots, saved areas, field logs or location, and we do not share them for advertising. Other users see an item only if you choose to share it with the Community. Pan photos you upload in the web app are stored privately in your account with camera location data removed. The service providers that run Pannable for us are listed in the Privacy Policy.
How do I delete my account?
In the web app open Account, scroll to Danger zone, type your email to confirm and press Delete my account. Deletion is immediate and permanent. The support page has the details, including the mobile app and email requests.
Talk to a person
Questions, bug reports, beta access or press:
support@pannable.app
Beta users can also use the Feedback button in the app (bottom left of the map; under More on a phone); it arrives with the page you were on so we can reproduce what you saw. More on the support page.